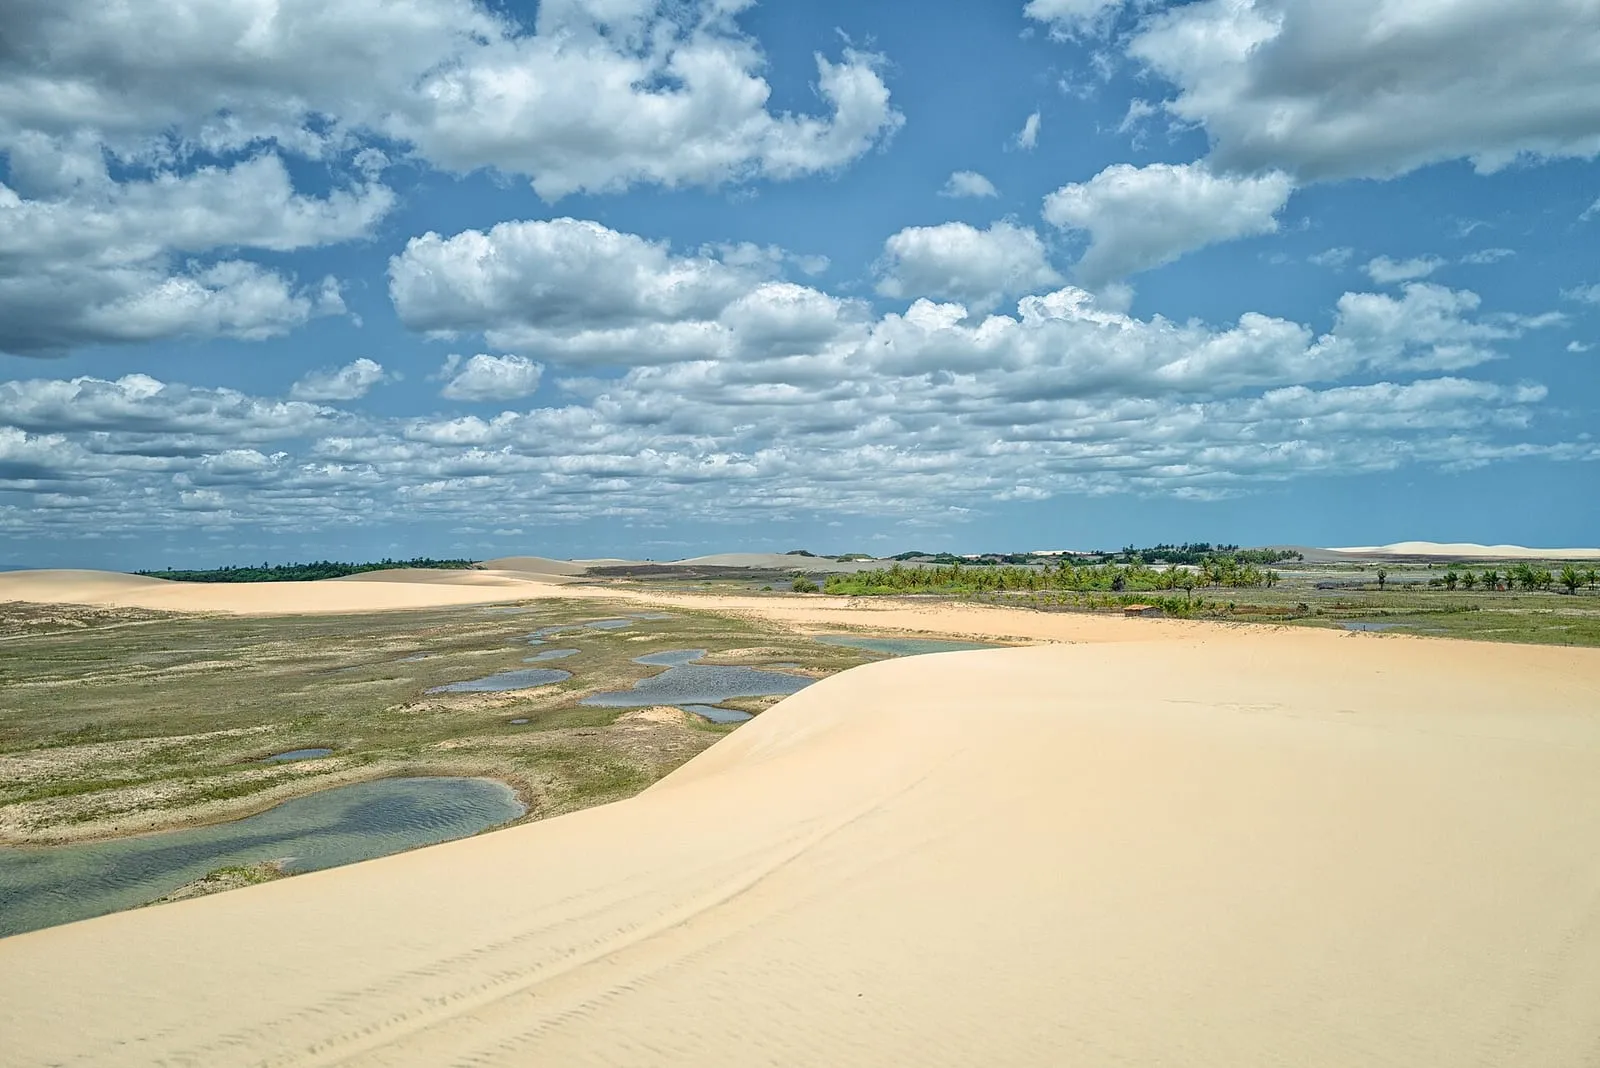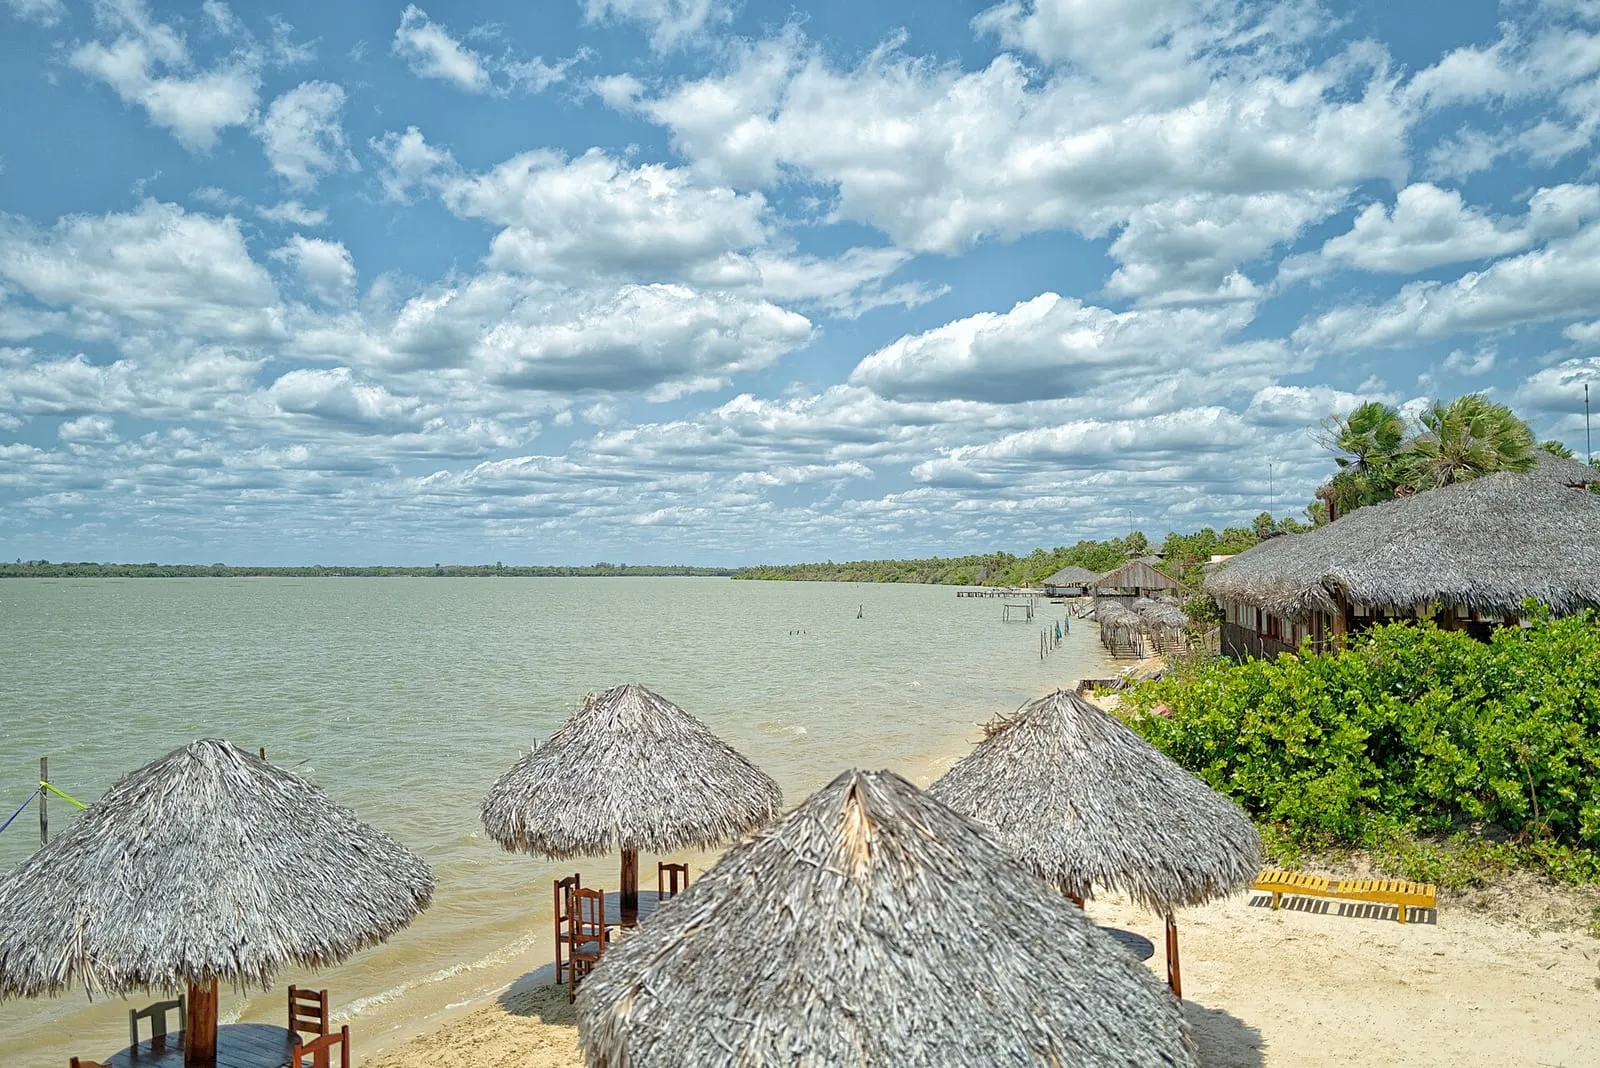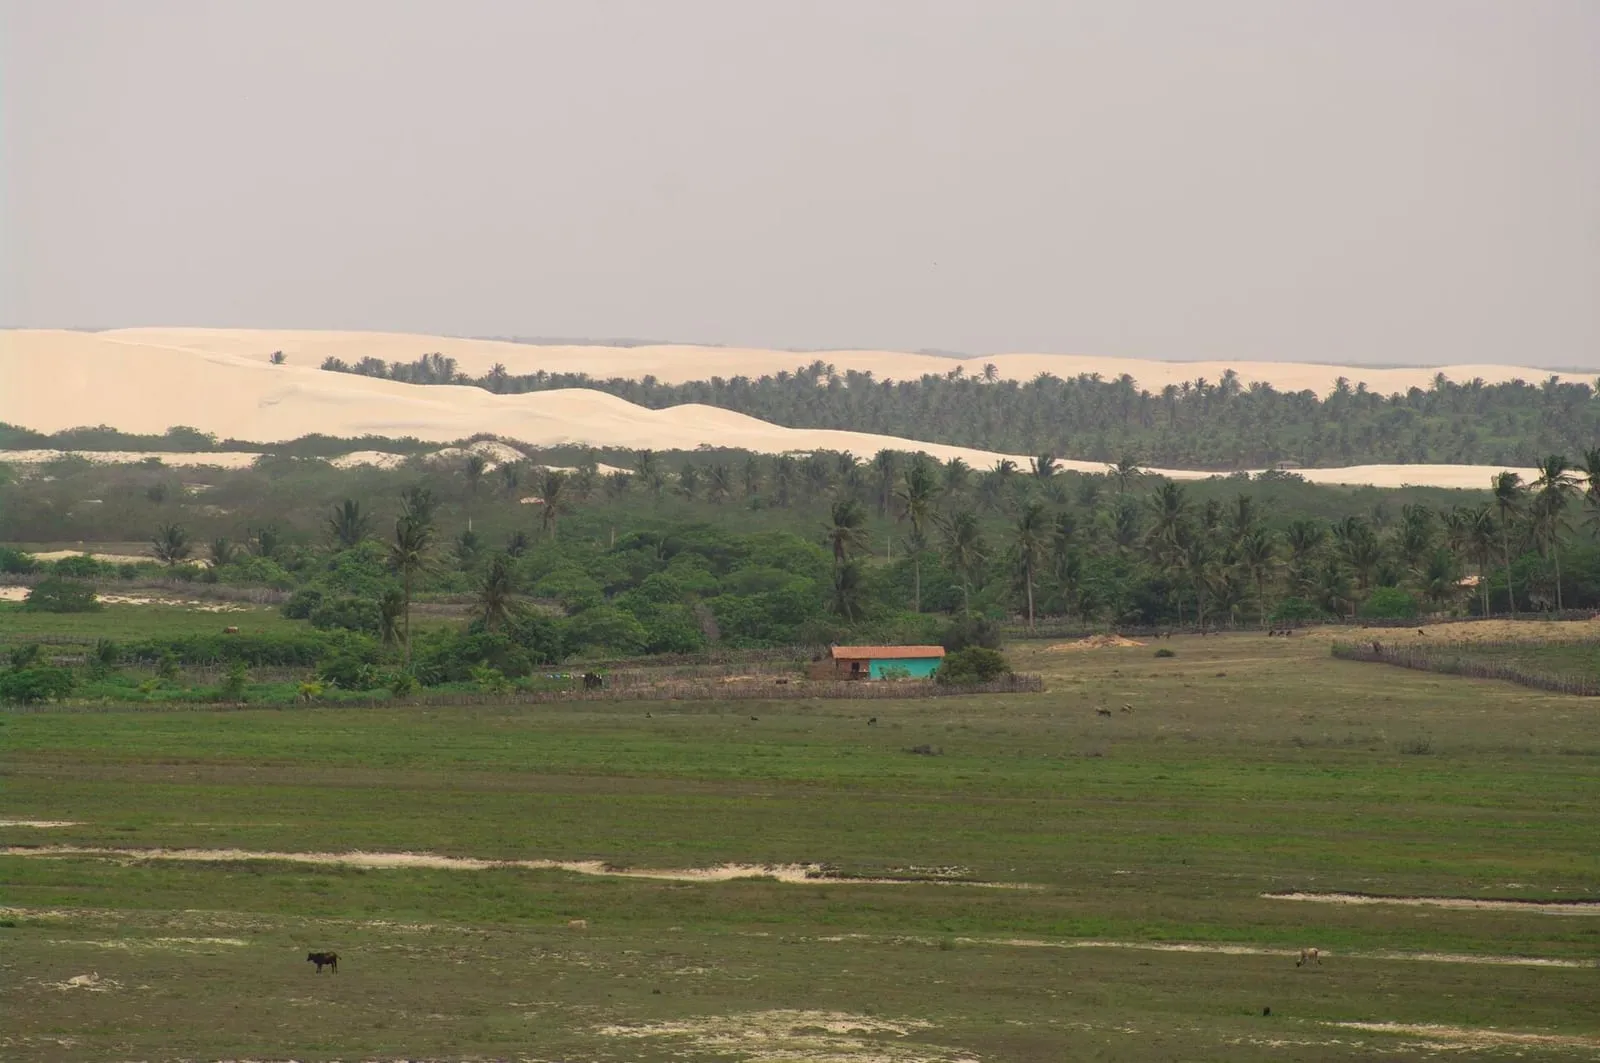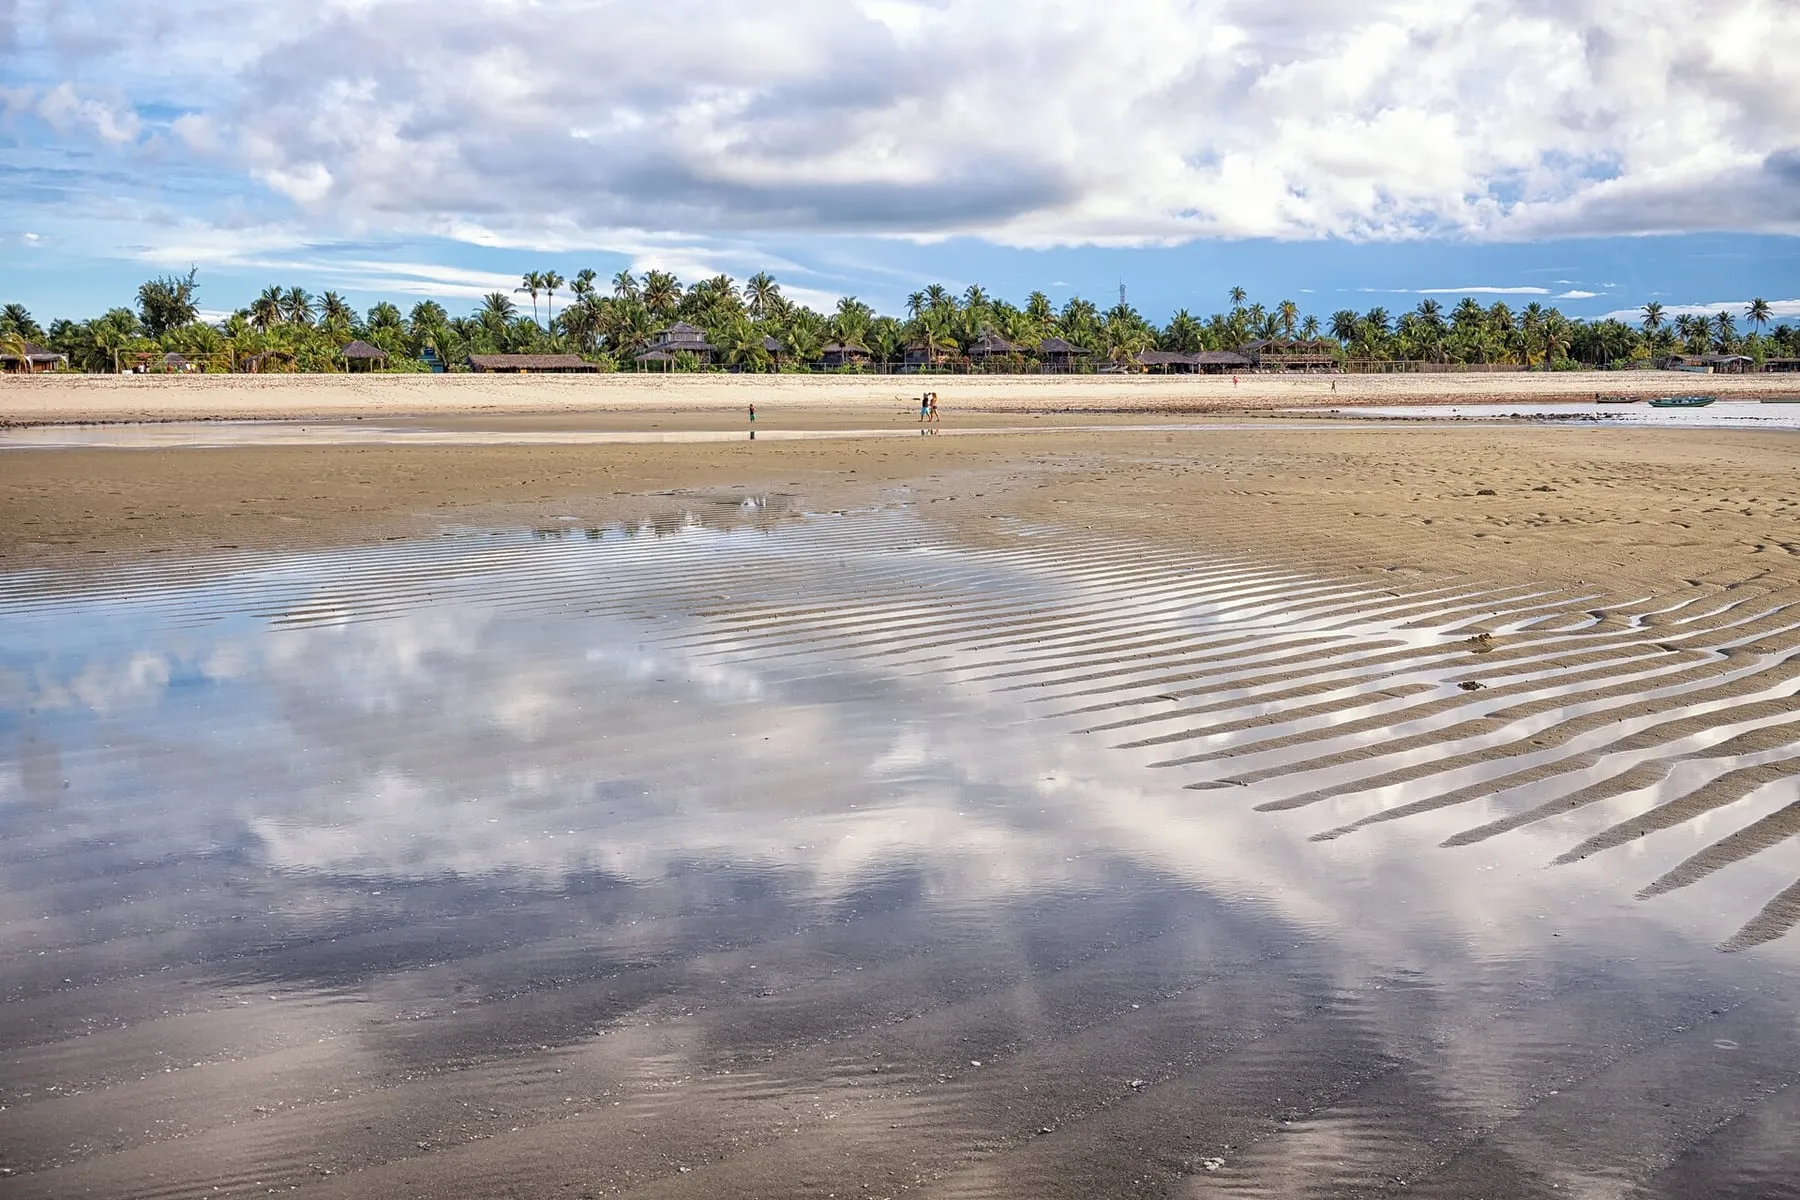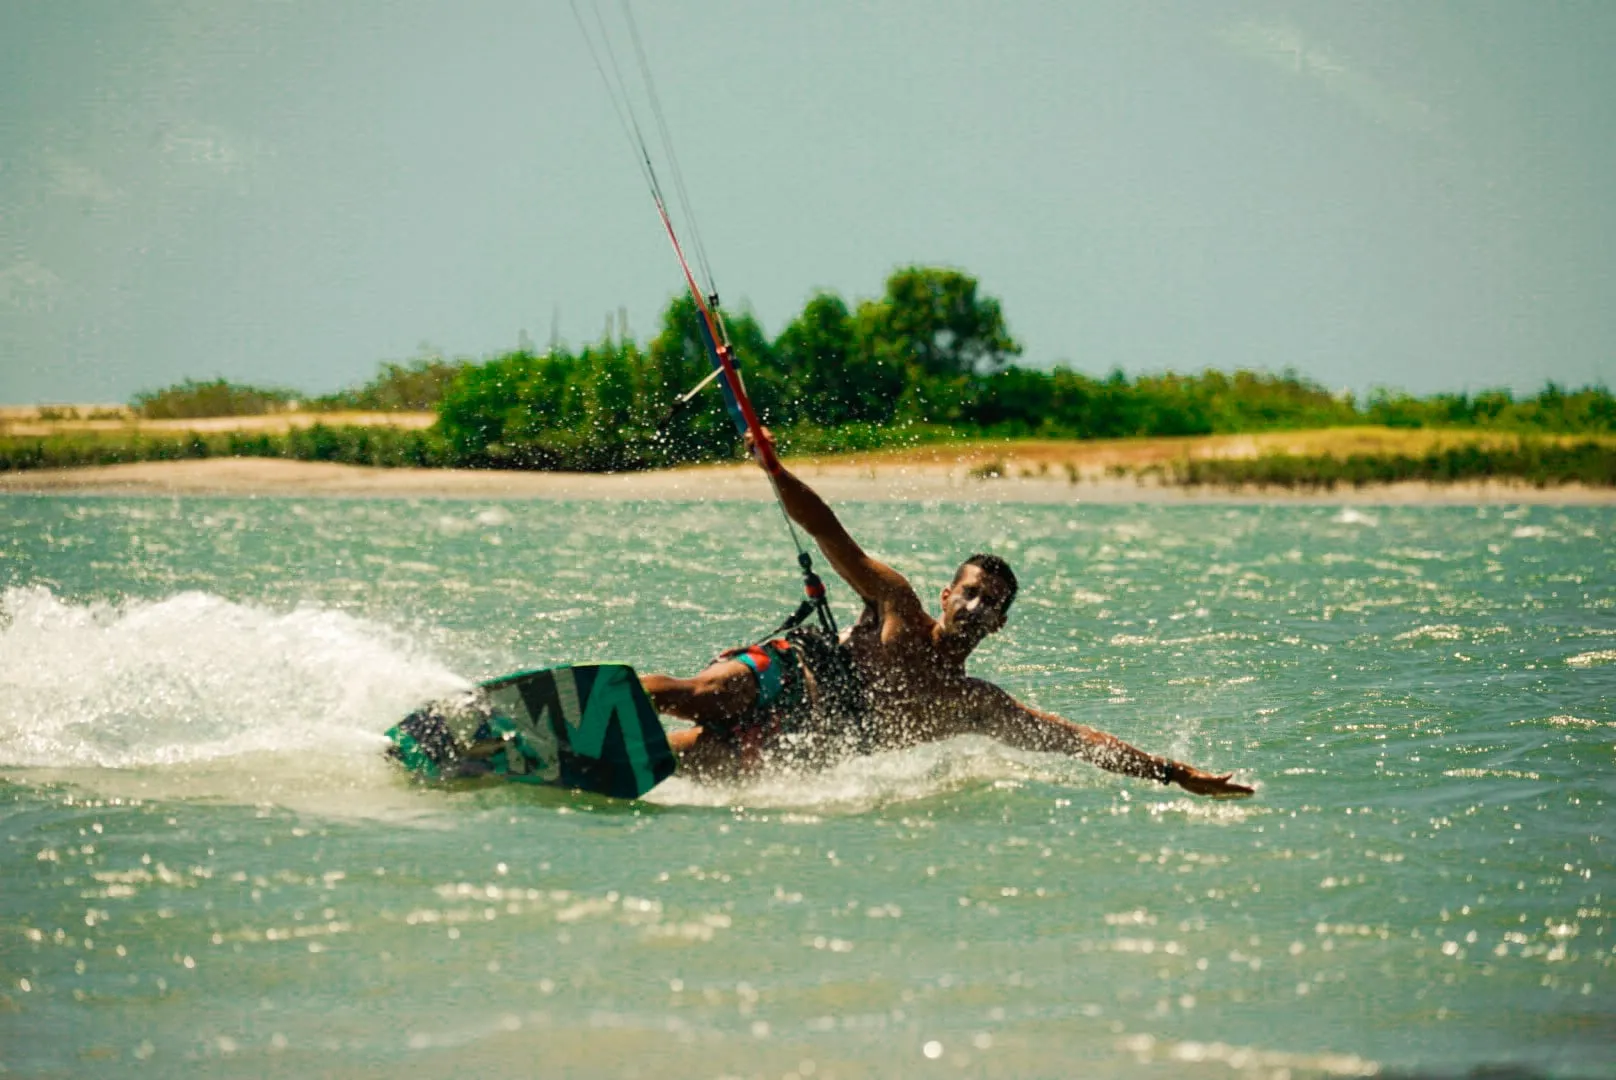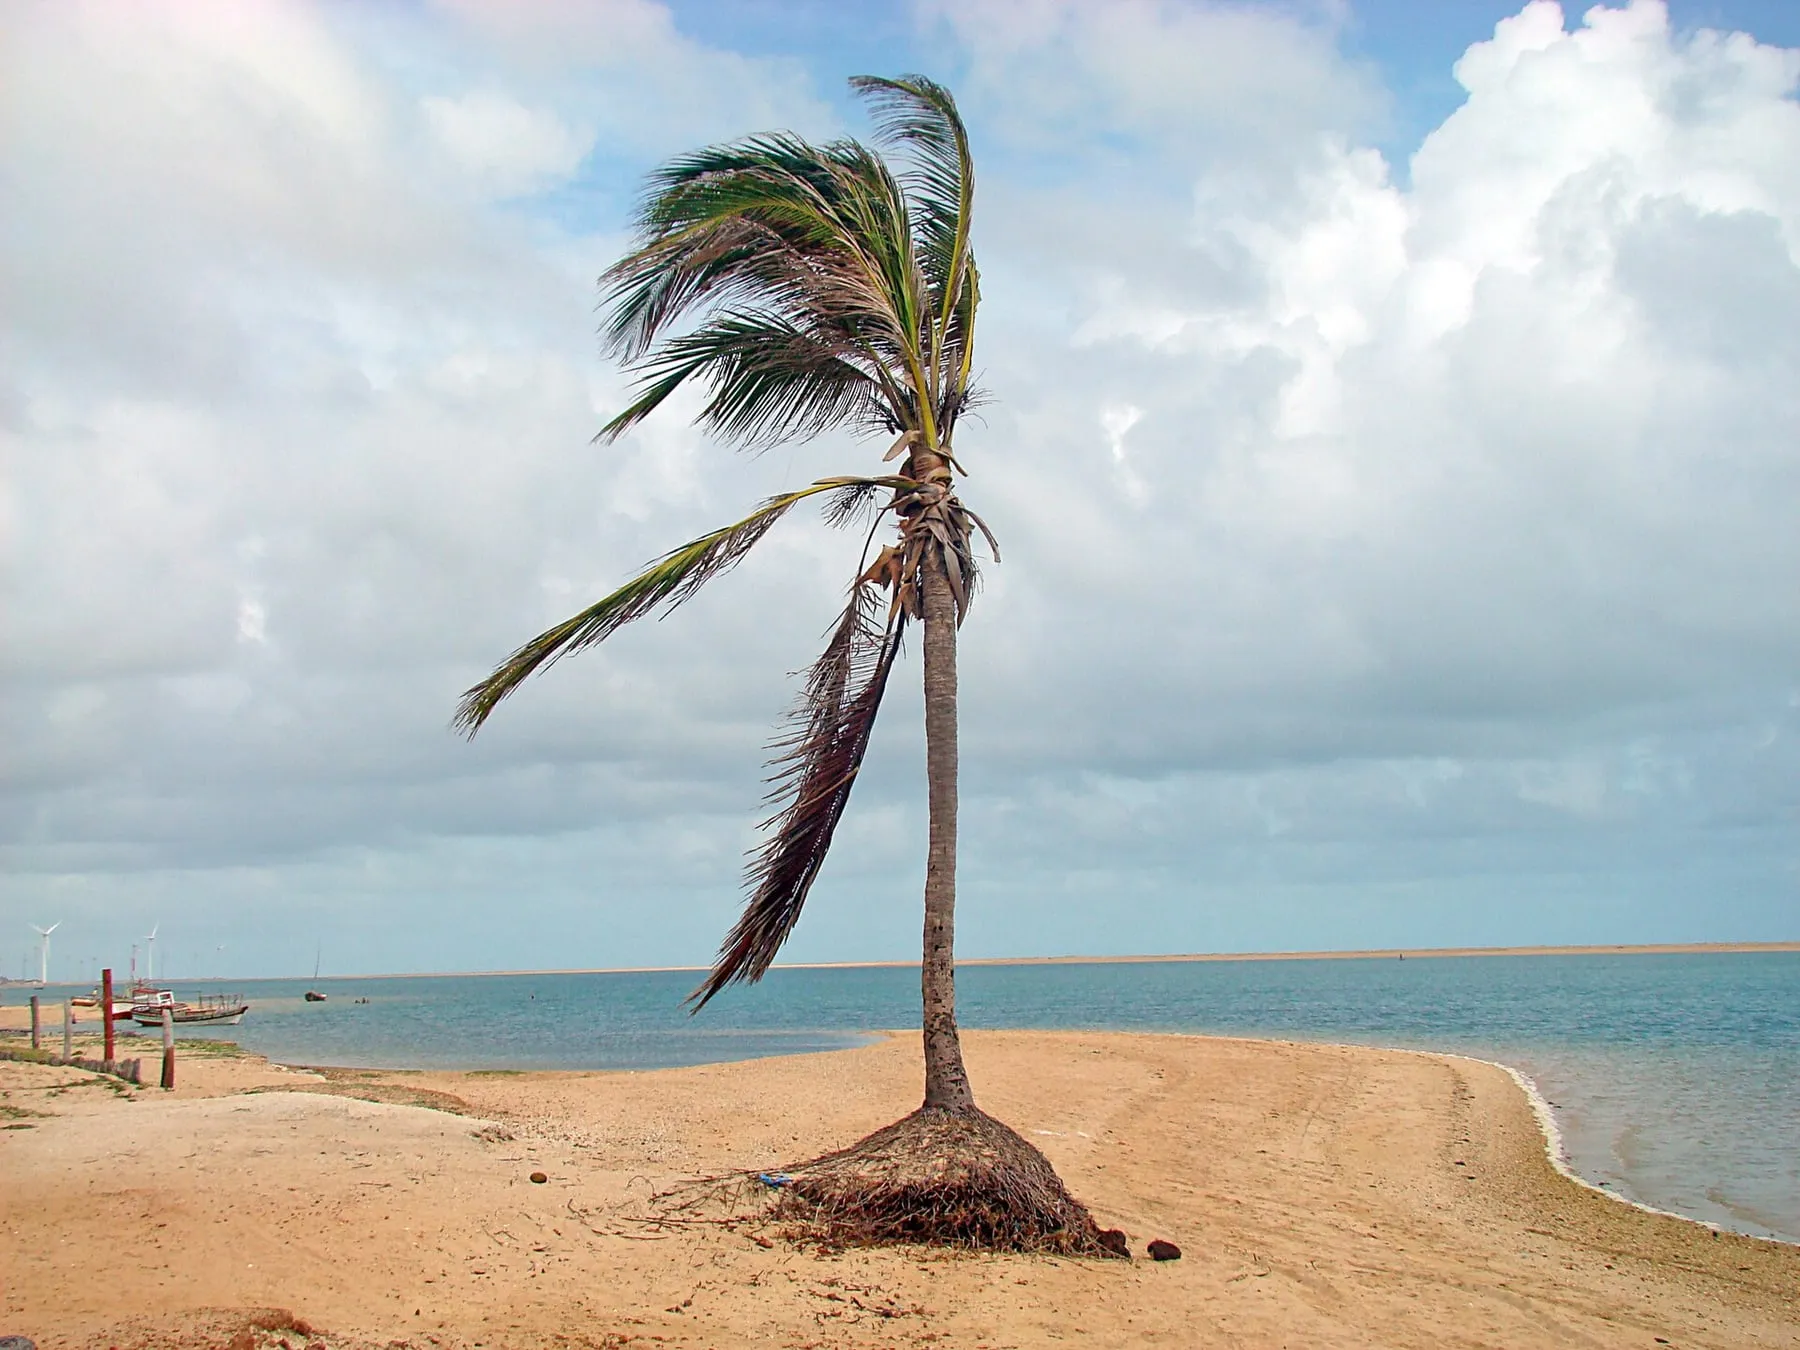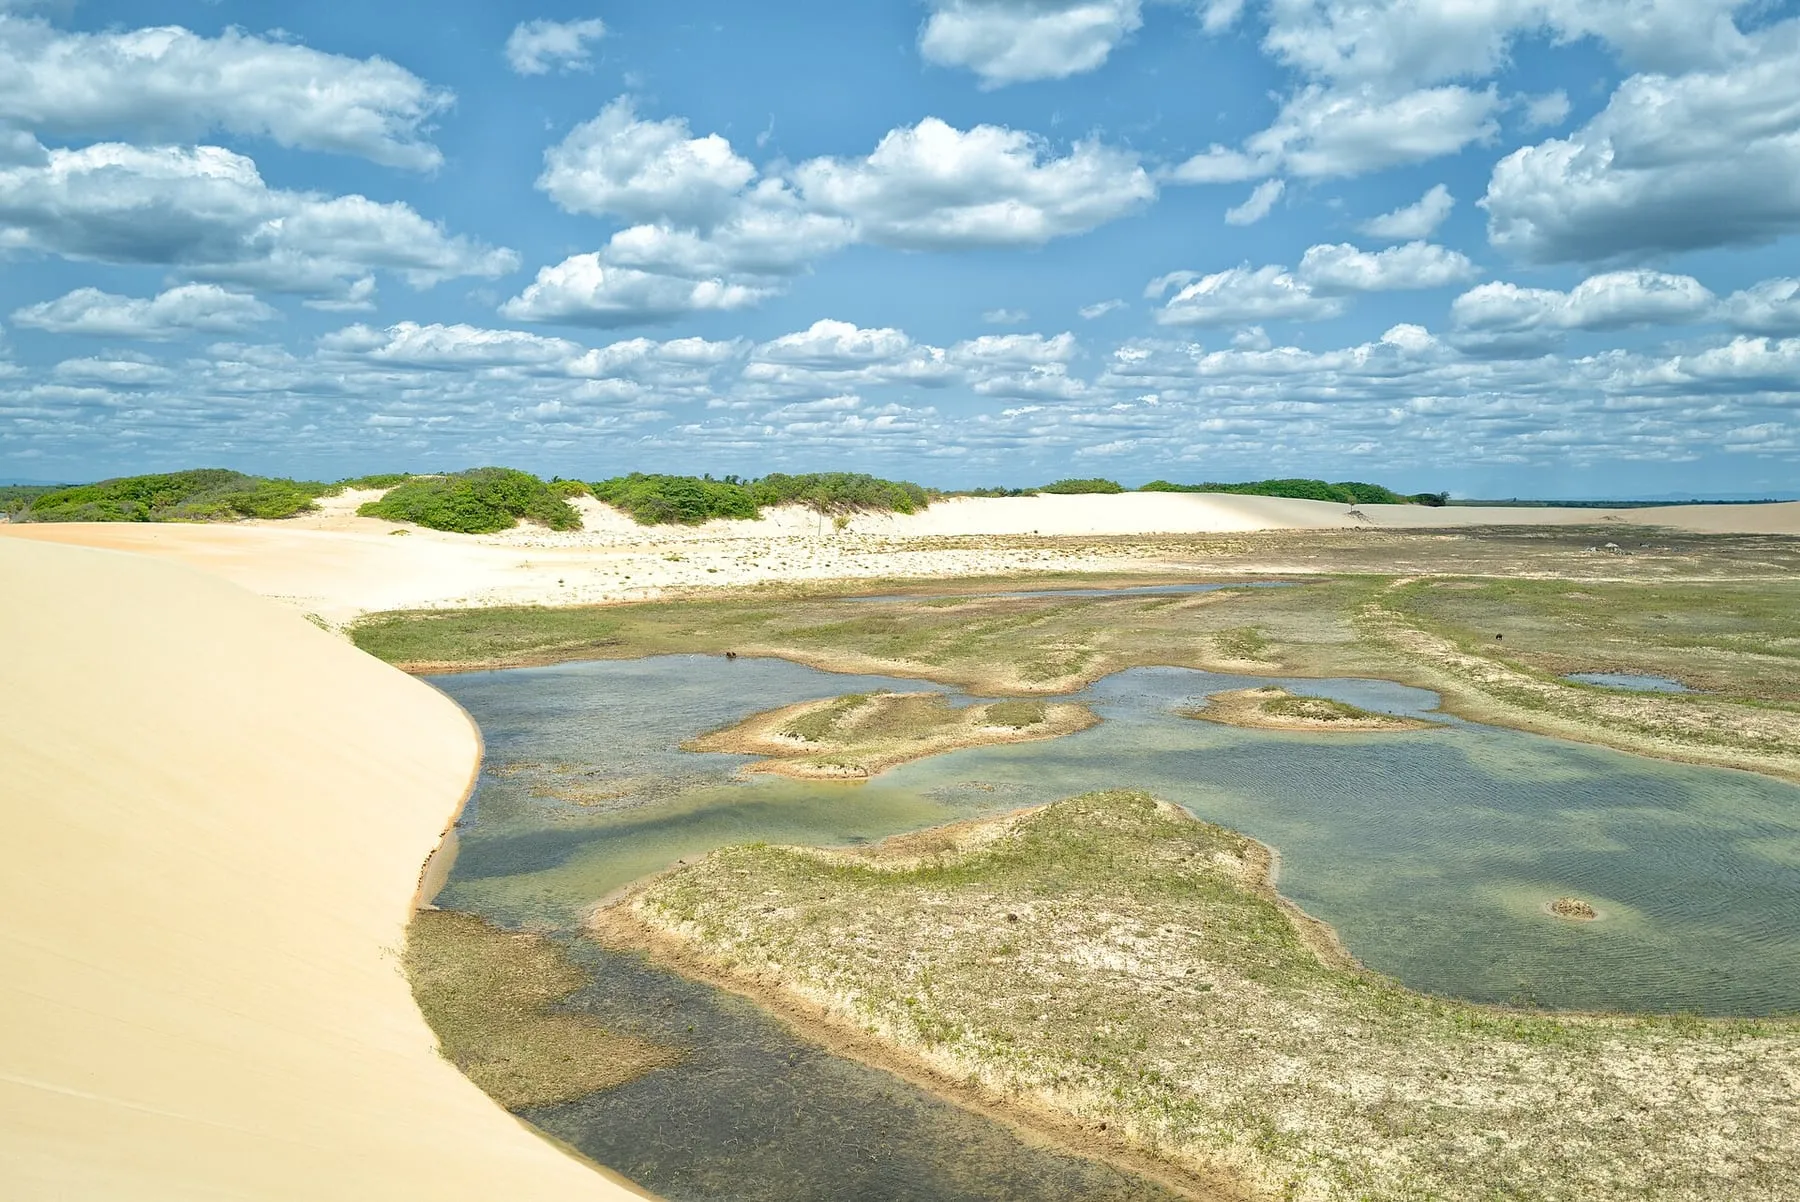
Tatajuba is in the municipality of Camocim, west of Jericoacoara, and is one of those places that seems to have fallen off the map. Huge dunes, mangrove, a big lagoon and very few people. For kitesurfing, that means flat water and plenty of space.
The spot
The highlight is Tatajuba Lagoon, freshwater, flat and shallow in most places. With the seasonal wind, it becomes a great place to practice in peace, away from the busier famous spots. On the sea, the coast remains open and straight, making Tatajuba the natural destination for downwind runs from Jericoacoara, passing through Guriú.
The lagoon changes quite a bit through the year: it depends on first-half rains. In dry years, the level drops and some areas get too shallow. Worth asking local schools how it looks before you go.
For whom
- Beginners and intermediates: the lagoon is calm and waveless.
- Experienced riders: downwind runs along the coast from Jeri.
- Those seeking peace: minimal infrastructure and plenty of space in the water.
Best season
Season generally runs from July to January, as on the rest of Ceará’s west coast. The lagoon tends to be fuller in the second half, after the rains.
How to get there
The most common access is from Jericoacoara, by buggy or 4x4, crossing the Guriú River by ferry. You can also reach it from Camocim. There’s no asphalt on the final stretch, so plan on high-clearance vehicles.
Tips
- Bring everything you need: infrastructure is very basic.
- Arrange downwind runs in advance and always with land support.
- Read the Jericoacoara and Preá guide and the article on downwind in Ceará.
Wind month by month
Model forecast for the sea off the spot. Data: MET Norway (yr.no), CC BY 4.0.
Average wind between 10:00 and 17:00, when sessions happen, and the share of days with an average of 15 knots or more.
% of days averaging 15 knots or more: <30% 30–54% 55–79% 80%+· Average wind: knots
| — | Average wind (knots) | Days with 15+ knots |
|---|---|---|
| jan | 13.7 | 37% |
| feb | 12.3 | 25% |
| mar | 10.6 | 6% |
| apr | 11.0 | 14% |
| may | 13.2 | 26% |
| jun | 14.3 | 44% |
| jul | 15.3 | 56% |
| aug | 17.6 | 87% |
| sep | 19.5 | 99% |
| oct | 19.1 | 93% |
| nov | 17.8 | 86% |
| dec | 16.3 | 71% |
Source: 10-year history (ERA5) via Open-Meteo, CC BY 4.0, measured at sea off the spot. This is a climate average, not a forecast. On the beach the wind can differ by a few knots due to thermal and terrain effects. For the coming days, check a forecast such as Windguru or Windfinder.
Photos of the spot